
 Voyager Atlas resource
Chart Pattern Guide
A basic visual guide to the price patterns every trader should know.
Chart patterns are repeating price action structures that form because of notable changes in buying and selling. When the economy is strong and institutional buying is strong, patterns tend to form bullish formations. When conditions are weak and institutional selling is strong, they tend to form bearish ones.
Put simply, price action follows three scenarios:

Prices go up when there is more buying than selling.

Prices go down when there is more selling than buying.

Prices move sideways when buying and selling are evenly matched.
Over time, these movements create the repeating patterns we see on the chart.
The five basic patterns

Bullish continuation
Brief rests or pauses within an uptrend. After the pullback or consolidation, the uptrend continues.
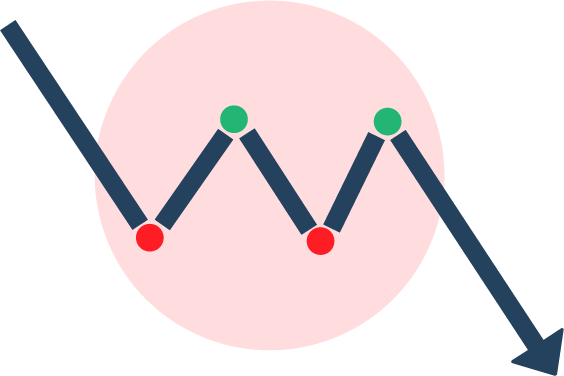
Bearish continuation
Brief rests or pauses within a downtrend. After a technical bounce, the downtrend continues.

Consolidation
A sideways movement in which the price moves between clear horizontal support and resistance levels.

Bullish reversal
A pattern at the bottom of a downtrend that shifts the trend from a downtrend to an uptrend.
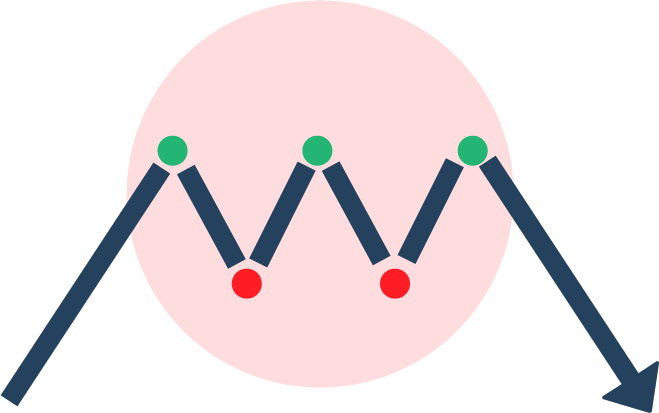
Bearish reversal
A pattern at the peak of an uptrend that shifts the trend from an uptrend to a downtrend.
1. Continuation patterns
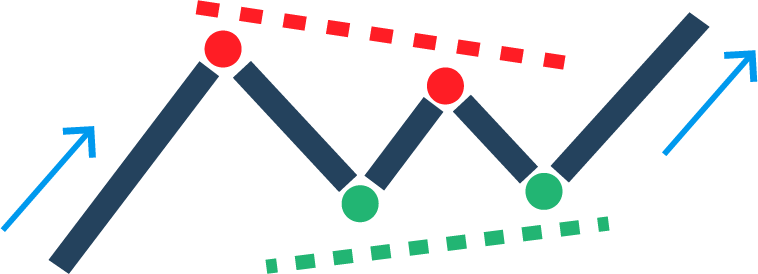
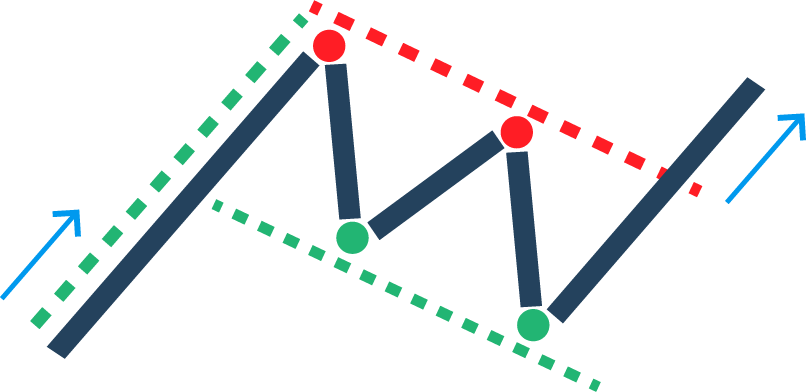
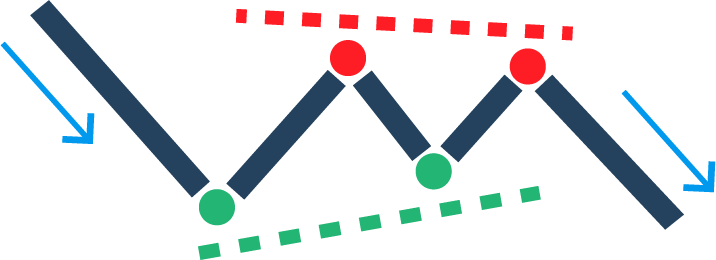
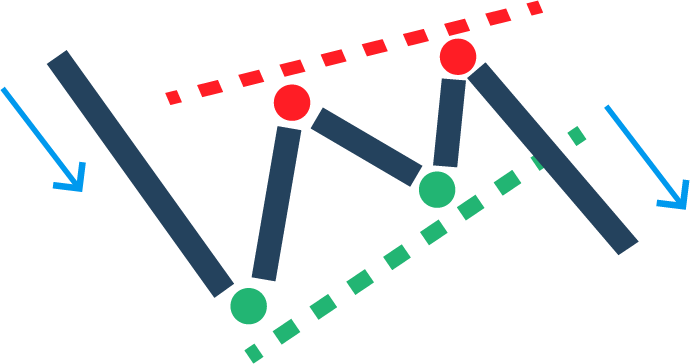
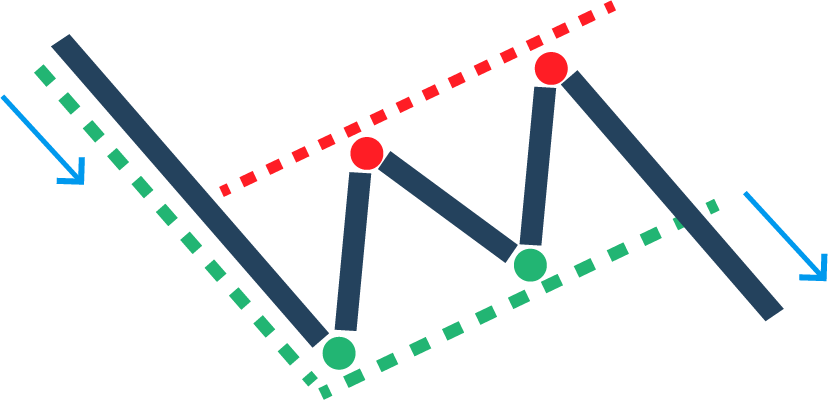
- Pennant
- A brief price contraction within two converging trendlines.
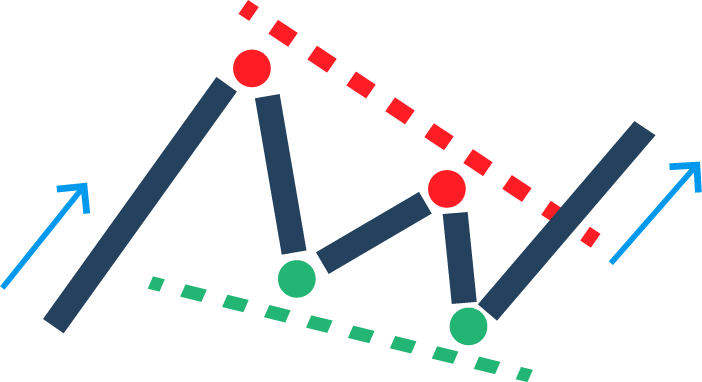
- Wedge
- A brief contraction within two converging trendlines angled up or down.
- Flag
- A brief consolidation between two parallel trendlines.
Bullish: appearing within an uptrend
Bearish: appearing within a downtrend
2. Reversal patterns
Reversal patterns are distinct formations in which a notable exchange between buyers and sellers takes place. Once the pattern completes, the trend shifts to a new direction.
Bullish reversal patterns

Cup and handle
A bullish formation defined by a U-shaped base (a rounding bottom), followed by a brief pullback with lower volatility. A breakout often follows once the pattern completes.

Inverted head and shoulders
A three-base formation along a neckline resistance. It points to a transition from bearish to bullish.
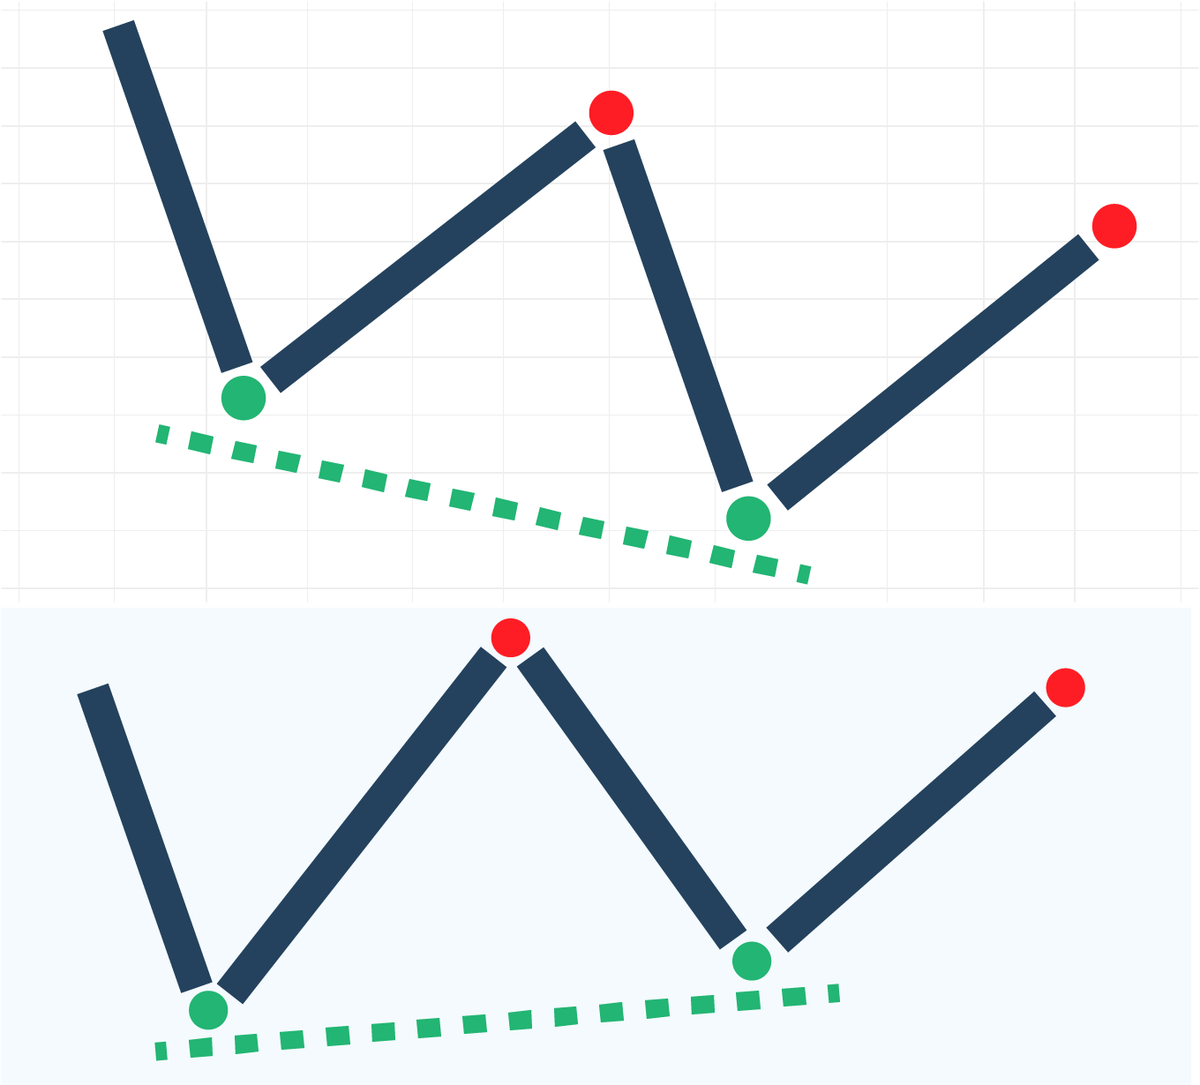
Bullish divergence
A technical indicator, usually the RSI, makes higher lows while the price makes lower lows. It signals weakening selling pressure that may turn into an uptrend.

Double bottom
A reversal pattern that often forms at a multi-year support level. After a bounce, the price retests support; as more buyers come in, a second bounce can carry the price through its first resistance.
Bearish reversal patterns
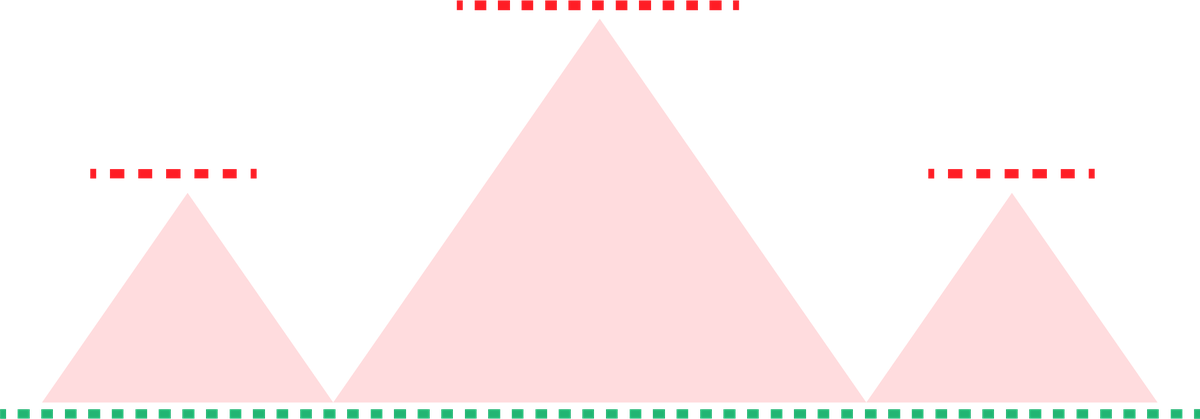
Head and shoulders
A three-peak formation along a neckline support. It points to a transition from bullish to bearish.
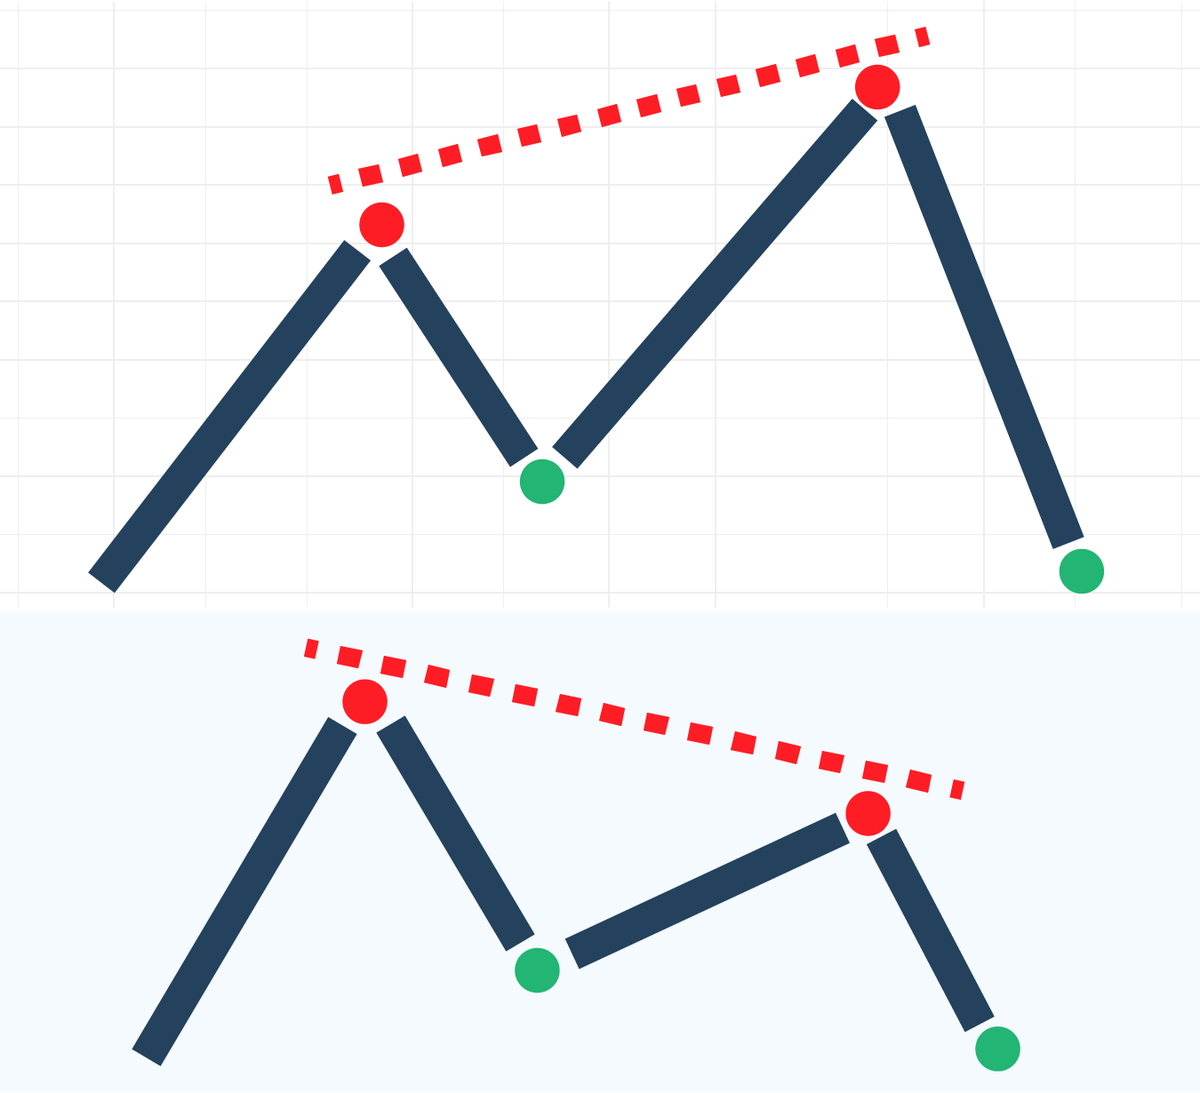
Bearish divergence
The RSI makes lower highs while the price makes higher highs. It shows weakening buying pressure that may turn into a downtrend.
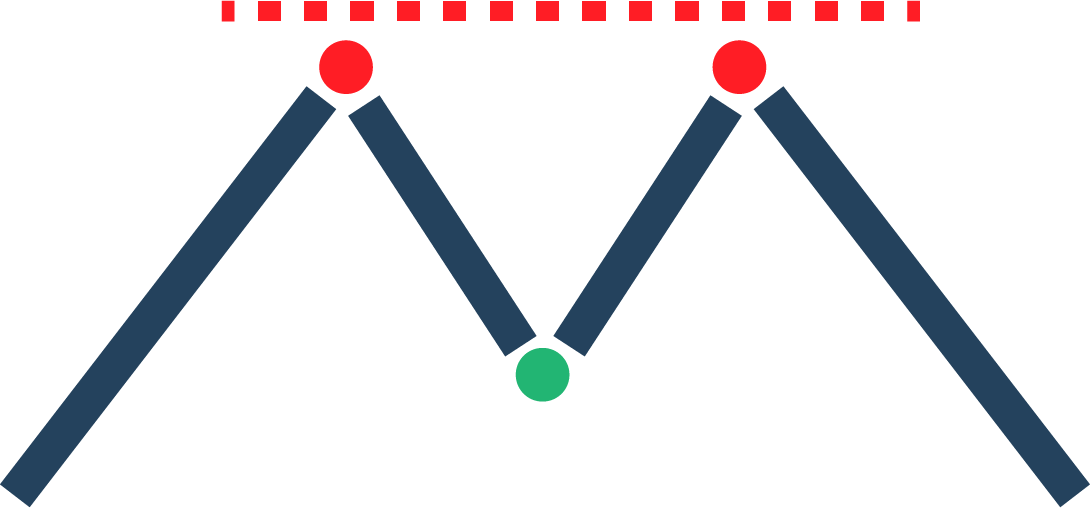
Double top
A reversal pattern that often forms at a multi-year resistance level. After a rejection and a brief pullback, the price retests resistance, is rejected again and breaks down when selling is sustained.
This guide is for educational purposes only and is not financial or investment advice. Investing involves risk, including the loss of capital.